


Making data meaningful: HEI formatted data profiles as Instagram slides to help make the data more widely accessible to local communities.
For any university or college, understanding local economic opportunity and the hopes and goals of community members is imperative for building responsive education programs that meet the needs of employers, learners, and workers. This is especially true for community colleges, who hold a vital community role in bridging offered degrees and certificates with employer demand for jobs. Yet, local economic data are rarely made highly accessible or presented in a creative way that is friendly to a wide audience. Economic projections and local demographic data usually come in the form of dense, hard-to-read reports full of line graphs.
At HEI, one of our favorite endeavors is to make data accessible for a wide audience. We’ve recently partnered with our client, Education Design Lab, to help them accomplish this goal for one cohort of their partner institutions. The Lab is an innovative organization that co-designs and builds equitable, learner-centered approaches with colleges, universities, employers, foundations, regions, and other partners. They kick off each of their design challenges with a series of “gallery walks,” bringing together a wide swath of local community leaders, learners, local media, and others around quantitative and qualitative data that paints a comprehensive picture of the experience of learners and the local community today. For their BRIDGES Rural design challenge, the Lab has brought together a cohort of rural community colleges across the nation to ask: How might we strengthen the capacity of rural community colleges to serve as critical economic growth engines for their learners and communities?
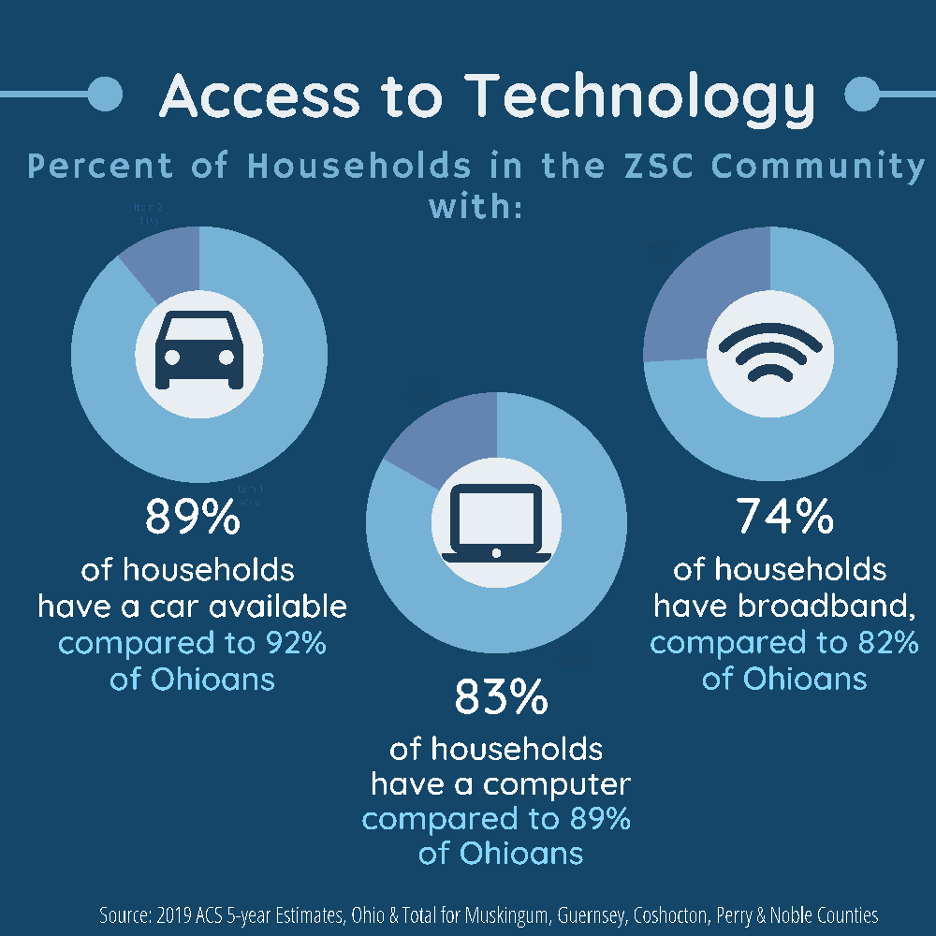
The Power of Infographics
To make economic data accessible to the audiences interested in the above question, HEI put together data profiles, formatted as Instagram slides. This accessible format made the data friendly to a wide audience and helped to inform the community about current demographics and future opportunities in the local area. Community colleges who were offered these data profiles learned more about what local populations they weren’t currently serving and how to tailor programs to meet potential learners where they are. “Our community college partners had never seen data put together in such a digestible, easy-to-understand format,” says Miriam Swords Kalk, Education Designer for BRIDGES, Education Design Lab. “It’s been a real game-changer for them to have access to such rich information about their local communities and surrounding regions to inform the design of new programs.”